Start with the evidence.
What India's land is up against, where we intend to work, what changes when restoration is done properly — and how we will prove it.
Degradation is already in the household ledger.
Rapid urbanisation, deforestation and unsustainable land use have compromised ecological balance across the country. The consequences are economic and social as much as environmental.
Forest cover lost in the last decade
State of Environment 2023Land affected by degradation
NAPPCCUrban areas facing extreme heat stress
ICFRE 2023Rural households dependent on forest resources
Rural livelihoodsEconomic disparity and environmental vulnerability
- Over 25% of India's rural population depends on agriculture and forestry for income.
- Over 40% of smallholder farming families face crop failure at least once every three years.
- Urban poverty stands at 17.3%, with millions living in areas of dangerously low green cover.
Sources: RBI 2023, IDS 2023, national urban estimates.
Deforestation and its long consequences
- Forest cover stands at 21.71% — far below the national target of 33%.
- Over 68% of India's land area shows varying degrees of soil degradation.
- An estimated 5.3 billion tonnes of soil erode annually, costing ₹92,000 crore in lost productivity.
Sources: ISFR 2021–22, ICAR 2023.
Phase-wise implementation.
Each phase has a defined timeline, hectare coverage and focus. Funding is released against phase completion, not calendar quarters.
| Phase | Timeline | Coverage | Focus areas |
|---|---|---|---|
| Pilot phase | 0–3 months | 5,000 ha | High-need urban and tribal pilot zones |
| Expansion phase | 4–6 months | 10,000 ha | Metro cities, Tier-2 and Tier-3 cities |
| Full scale | 1 year+ | 20,000+ ha | Rural, coastal and agricultural heartlands |
Land under active restoration at full scale
Urban, peri-urban, coastal, agricultural and tribal
Aligned to Climate Action and Life on Land
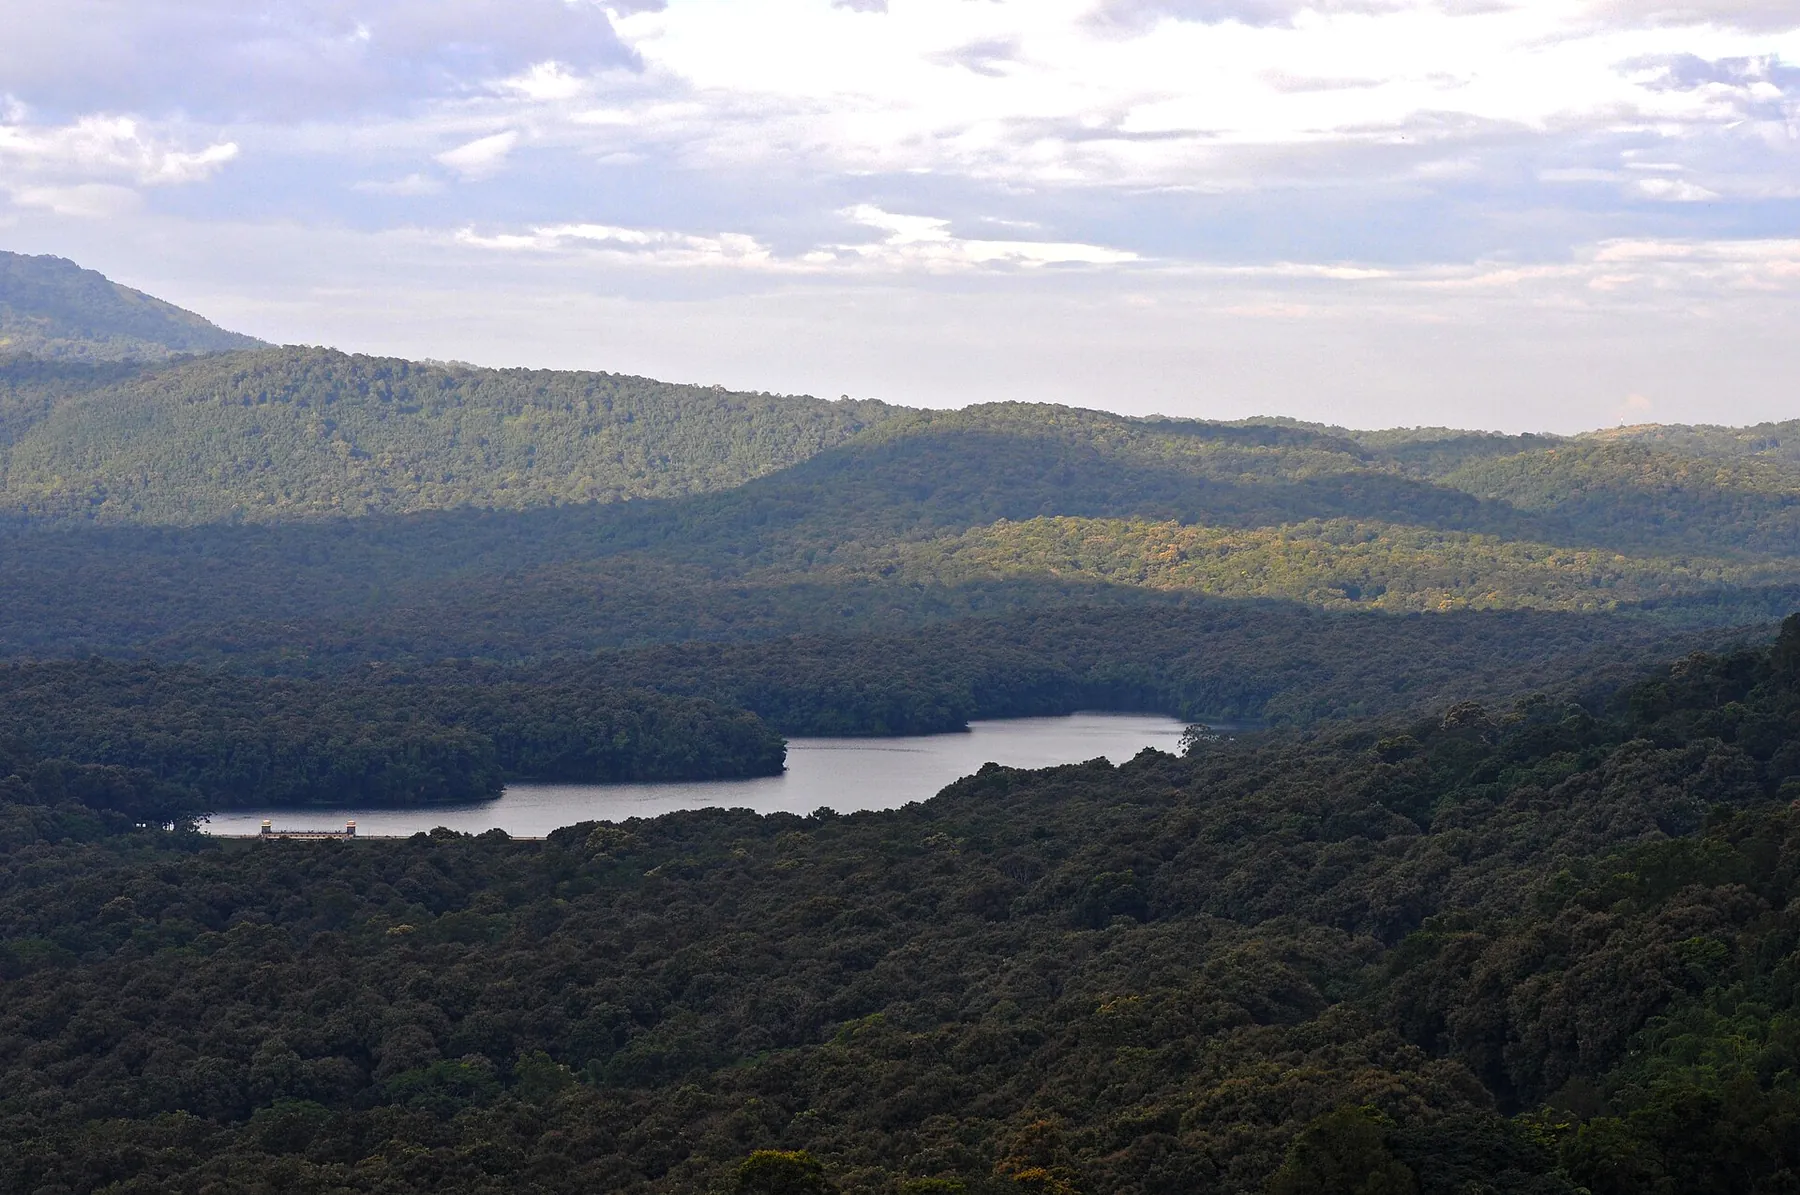
Continuous forest cover, Western Ghats.Where restoration pays back
Where the work happens.
Sites are chosen where ecological need, land degradation and climate vulnerability overlap. The programme is national in ambition but deliberately local in execution.
- Urban ecological zones
- Delhi, Mumbai, Kolkata, Chennai, Bengaluru, Hyderabad
- Peri-urban & industrial land
- Pune, Ahmedabad, Surat
- Coastal & wetlands
- Communities near major ports and river deltas
- Agricultural heartlands
- Noida, Gurugram, Ludhiana, Coimbatore
- Rural & tribal areas
- Uttar Pradesh, Bihar, Madhya Pradesh, Odisha, Jharkhand
What a restored landscape returns.
Restoration pays back in air, water, soil, income and health. These are the outcomes the programme is designed to produce.
Biodiversity
Large-scale native plantation combats deforestation and restores habitat structure for birds, insects and soil organisms.
Air & water
Improved air and water quality, reduced urban heat stress and lower healthcare costs in the neighbourhoods that need it most.
Employment
Jobs created in ecological restoration and nursery management, with training that stays in the community.
Enterprise
Sustainable ecological enterprises — saplings, compost, organic produce — generate income for vulnerable households.
Global alignment
Direct contribution to UN SDG 13 (Climate Action) and SDG 15 (Life on Land), reported annually.
A replicable model
A scalable blueprint that can be adapted by other districts and states — and inspected by anyone who funds it.
Beyond individual benefits, the programme strengthens social networks, encourages eco-volunteerism, reduces environment-driven displacement, and promotes composting, agroforestry and ecological waste management.
How we will know it worked.
A structured M&E framework tracks plantation progress, soil health, community participation and programme efficiency — and reports all of it.
Key success metrics
- Saplings planted, survival rates and green-cover expansion.
- Community green-zone health: tree survival, soil quality, species diversity.
- Ecological waste reduced and soil rehabilitated.
- Local heat-stress reduction and measurable biodiversity increase.
- Economic relief for farming households and jobs in nursery management.
- Community participation, volunteer engagement and partnership count.
Data collection & analysis
- Beneficiary surveys and face-to-face interviews on plantation quality, ecological impact and social benefit.
- On-site assessments by project coordinators to evaluate efficiency and participation.
- A digital tracking system: mobile application and dashboard recording daily plantation activity.
- Periodic ecological assessments with local environmental centres, using biodiversity indices.
- Transparent financial tracking with regular audits and public reviews for donors.
Feedback & impact assessment
- Quarterly community feedback sessions to address ecological quality concerns.
- Regular meetings with volunteers and partners on plantation strategy and funding.
- Grievance redressal: helpline and complaint portal for community members.
- Quarterly reports documenting achievements, challenges and financial updates.
- An annual impact report analysing ecological effectiveness and success stories.
What donors receive
A programme dashboard covering the sites you fund, plantation counts against target, survival rates, community participation and fund utilisation — plus the quarterly report and the annual audited impact report. Site visits can be arranged for funding partners.
Fund the phase you can see.
Support is structured by phase and by site, so you know exactly which hectares your money is restoring.